AI TOOL / #02469
Chartify
AI-driven chart and graphic generation enabled through natural language queries.
Introduction
AI-powered chart and graph generation from data using natural language queries.
What is Chartify?
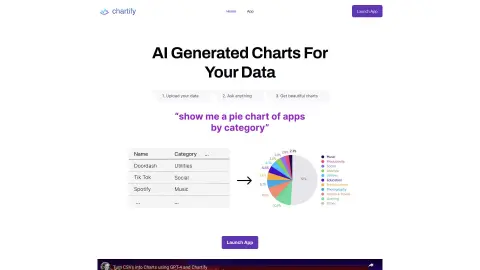
Chartify utilizes OpenAI’s GPT3 model to generate charts and graphs from CSV files and databases. You can use natural language to query the data and obtain both the visual representations themselves as well as the underlying code used by tools like Plotly, Matplotlib, and Seaborn. Convert CSV files and database tables into rich, interactive charts. Let our AI suggest new ways to visualize your data, or generate various types of charts according to your specific requirements – from pie charts to line graphs and bar charts.
How to use Chartify?
1. Upload your data (in CSV format, or via Postgres/MySQL).
2. Obtain the visualizations recommended by the AI system.
3. Submit questions to generate charts using Plotly, Matplotlib, Seaborn, or Charts.js.
The core features of Chartify
AI-driven chart generation
Natural language data query
Supports a variety of charting libraries, including Plotly, Matplotlib, Seaborn, and Charts.js.
Connecting CSV files to databases
Natural language data query
Supports a variety of charting libraries, including Plotly, Matplotlib, Seaborn, and Charts.js.
Connecting CSV files to databases
Related
Reassurance AI (Beta)
A platform where creators can generate income through tips, membership fees, and sales.
CleanView by ActiveFence
A free browser extension that obscures and desaturates online content that poses security risks, thereby protecting professionals working in this field.
SmileAI
Leverage AI-powered applications designed to foster positive emotions and mental well-being.
BlissBot
AI chatbot for mental, emotion...
Soulnests
An AI-based diary app dedicated to promoting emotional well-being and personal growth.
iprevail.com
iPrevail provides on-demand mental health support, including peer counseling, guidance, and learning programs.